Sustainable Futures
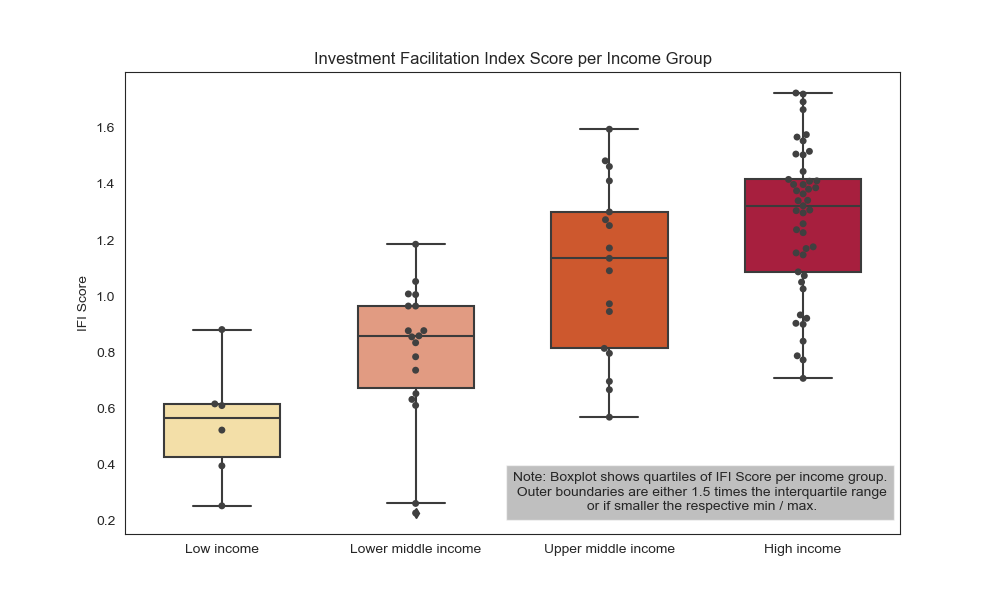
Marge of the IFI for low, lower middle, upper middle and high incomes
Deine E-Mail-Adresse wird nicht veröffentlicht. Erforderliche Felder sind mit * markiert
Kommentar *
Name *
E-Mail-Adresse *
Website
Δ
Schreibe einen Kommentar